Business & Finance
Menu Engineering Matrix Explained :
Most restaurant owners still price and promote dishes based on gut feel or “what sells.” That approach leaves money on the table. The Menu Engineering Matrix gives you a clearer system. It sorts every item by two numbers only: contribution margin in dollars and how often guests actually order it. Once you plot those numbers, the next moves become obvious.
This matrix has been used in hospitality programs for decades. When you combine it with strong Restaurant Branding & Menu Design: Increase Orders work, the results compound. The matrix tells you what to push. The branding and layout tell you how to push it without feeling salesy.
Here’s exactly how the matrix works and how to use it.
The Four Boxes That Matter
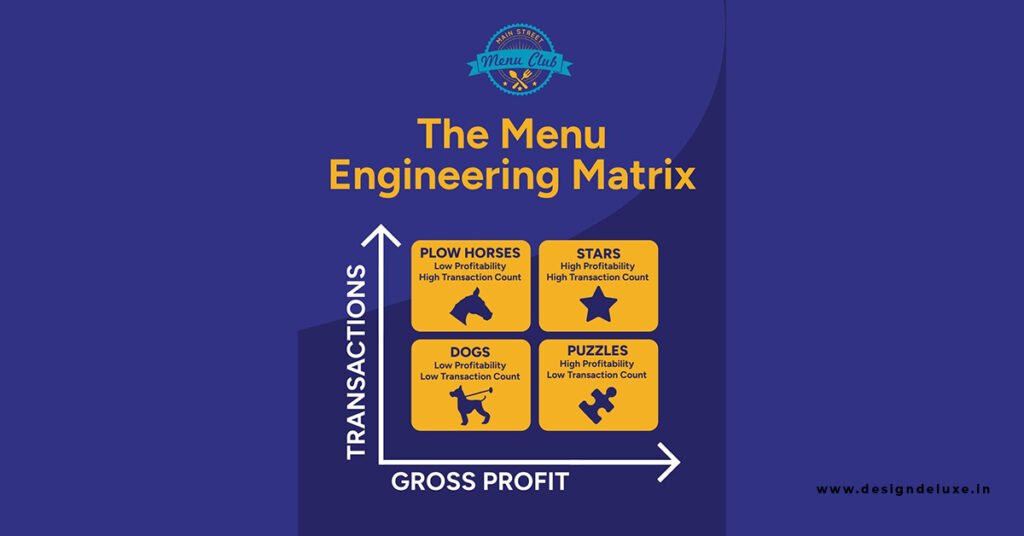
Plot every dish on a simple grid:
- Vertical axis: Contribution margin (menu price minus true recipe cost)
- Horizontal axis: Popularity (units sold over a set period, usually 30–90 days)
You end up with four categories.
Stars
High margin + high popularity.
These are your money-makers. Protect them. Give them the best placement on the menu, the strongest descriptions, and the cleanest photos. Never bury a Star.
Plowhorses
Low margin + high popularity.
Guests love them, but they don’t pay the bills. Options: carefully raise the price, shrink the portion slightly, or create a premium upgrade path (add avocado, upgrade the protein, make it a “loaded” version). The goal is to improve the margin without killing the volume.
Puzzles
High margin + low popularity.
These dishes are profitable when ordered—but they rarely get ordered. Fix the name, rewrite the description with sensory language, move them into better real estate, or pair them with a photo. Many Puzzles become Stars once guests actually notice them.
Dogs
Low margin + low popularity.
These cost you time, inventory space, and kitchen attention for almost no return. Cut them or completely reinvent them. Keeping Dogs on the menu is one of the quietest ways restaurants lose money.
That’s the entire system. No complicated software required at the start.
How to Build Your Own Menu Engineering Matrix
- Pull 60–90 days of item-level sales data from your POS.
- Calculate true food cost for each dish (ingredients only, not labor).
- Subtract food cost from menu price to get contribution margin in dollars.
- Rank items by units sold.
- Plot them on the four-box grid.
- Label every dish: Star, Plowhorse, Puzzle, or Dog.
Most operators are surprised by at least two or three items. The dish everyone assumes is a Star sometimes turns out to be a Plowhorse. The quiet high-margin item nobody talks about is often a Puzzle waiting to be fixed.
Turning the Matrix into Action
Once the boxes are filled, decisions get simpler.
Stars
Keep them front and center. In Restaurant Branding & Menu Design: Increase Orders work, these go into the upper-right and center zones of the menu. Use the strongest language and any visual emphasis you allow yourself.
Plowhorses
Test a modest price increase first. If volume holds, you’ve improved margin without losing the popularity. If volume drops, look at portion or presentation cost instead.
Puzzles
Rewrite the description. Move the item higher on the page or into a highlighted section. Add a simple “Chef’s Recommendation” or “Guest Favorite” label if the data supports it. Many Puzzles only need better visibility.
Dogs
Remove them. Use the freed-up kitchen capacity and inventory dollars on items that actually contribute. Guests rarely notice when a weak item disappears.
Common Mistakes When Using the Matrix
Treating popularity as more important than margin. Volume feels good, but contribution margin pays the rent.
Recalculating too infrequently. Costs change. Run the matrix at least every quarter, or after any major supplier shift.
Ignoring the emotional side of the brand. A pure numbers approach can make the menu feel cold. The matrix tells you which items deserve the spotlight. Your branding and design work make those items feel worth ordering.
Over-complicating the first version. Start with a simple spreadsheet. Fancy software can come later.
How the Matrix Ties Directly to Higher Checks
When you consistently promote Stars, fix Puzzles, improve Plowhorses, and cut Dogs, two things happen. Average check rises because guests are steered toward better-margin items. Food cost percentage usually drops because the mix improves. You did not raise every price or change the concept. You simply stopped promoting the wrong dishes.
This is why the matrix pairs so well with thoughtful menu design. The numbers show you the targets. Placement, language, pricing presentation, and visual hierarchy do the quiet work of moving guests toward those targets.
Getting Started This Week
Export last quarter’s sales. Calculate contribution margins for your top 20–25 items. Plot them. Label the four categories. Then look at your current menu and ask one question: Do the Stars sit in the strongest positions with the best descriptions?
If the answer is no, you already know the first changes to make.
The Menu Engineering Matrix is not theory. It is a practical filter that forces clearer decisions. Use it regularly and the difference shows up in both the average check and the end-of-month numbers.
Key Takeaways
- The Menu Engineering Matrix classifies every menu item into one of four categories—Stars, Plowhorses, Puzzles, or Dogs—based on popularity (sales volume) and profitability (contribution margin).
- Stars (high popularity + high profit) should be protected and promoted; Plowhorses (high popularity + low profit) need cost control or price adjustments; Puzzles (low popularity + high profit) require better merchandising or repositioning; Dogs (low popularity + low profit) should be reworked or removed.
- Regular analysis of the matrix helps restaurants increase overall profit by focusing efforts on the items that truly drive revenue and by making data-driven decisions about pricing, promotion, and menu design.
FAQs
1. What is the Menu Engineering Matrix?
It is a strategic tool that plots menu items on a 2×2 grid according to their popularity (number of times sold) and profitability (contribution margin) so operators can decide which dishes to promote, reprice, redesign, or eliminate.
2. How do you calculate the two axes of the matrix?
Popularity is measured by sales volume (or percentage of total items sold). Profitability is measured by contribution margin (selling price minus food cost). Items above the average on both metrics become Stars; the other three quadrants follow from the remaining combinations.
3. How often should a restaurant update its Menu Engineering Matrix?
Most operators review it monthly or quarterly, or whenever major cost changes, seasonal menu shifts, or significant sales pattern changes occur, so decisions stay current with actual performance.