AD Video / Motion Graphics
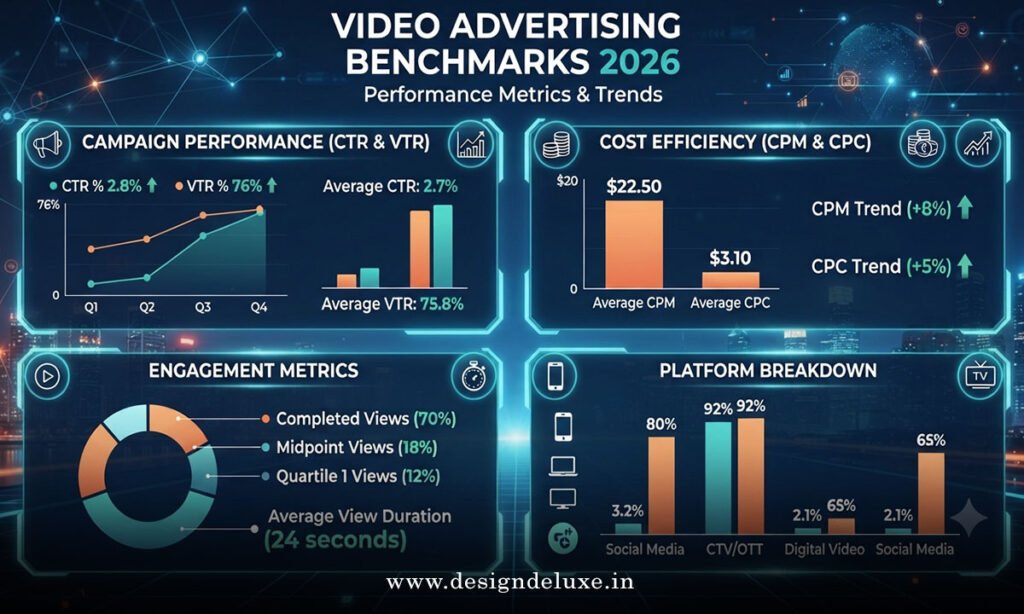
Video Advertising Benchmarks 2026 give performance marketers the hard numbers needed to set realistic targets, diagnose underperforming campaigns, and decide where to allocate budget across Meta, TikTok, YouTube, and beyond. These figures reflect the current auction environment, creative fatigue cycles, and platform algorithm shifts that define what “good” actually looks like right now.
- Meta video ads commonly deliver median CTRs between 1.5–1.8% with CPMs in the $8–15 range for most DTC accounts.
- TikTok in-feed video CTRs sit lower (often 0.8–1.5%) but CPMs remain more efficient for younger audiences.
- YouTube in-stream completion rates average 30–35% while CTRs hover around 0.4–0.7%.
- Hook rates (3-second views) of 25–40% separate average creatives from top performers across social platforms.
- ROAS medians for well-run e-commerce video campaigns typically land between 2–4x depending on vertical and funnel stage.
In my experience, teams that ignore these ranges either over-celebrate mediocre results or panic when numbers fall short of outdated 2023 expectations. The real value of benchmarks is calibration, not dogma.
Core Video Advertising Benchmarks 2026 by Platform
Platform averages hide a lot of variance by industry, objective, and creative quality. Still, these ranges provide the starting point most accounts should measure against.
| Platform | Median CTR (Video) | Typical CPM (US) | Hook Rate (2–3s) | Completion Rate | Notes |
|---|---|---|---|---|---|
| Meta (Feed + Reels) | 1.5–1.8% | $8–15 | 25–40% | 15–25% | Strongest targeting + higher CTR |
| TikTok In-Feed | 0.8–1.5% | $5–12 | 25–40% | 25–35% | Lower cost, faster fatigue |
| YouTube In-Stream | 0.4–0.7% | $5–15 | N/A (skip) | 30–35% | Better for consideration |
| YouTube Shorts | 1.0–1.4% | $5–12 | 25–35% | 25–35% | Closer to social performance |
| 0.4–0.7% | $25–45 | 15–25% | 20–30% | B2B premium pricing |
These numbers come from aggregated 2025–2026 campaign data reported by sources including WordStream’s LocaliQ analysis of tens of thousands of campaigns and multiple independent creative analytics platforms.
Your actual results will move up or down based on vertical. Fashion and beauty often clear the higher end of CTR ranges. Finance, legal, and B2B SaaS sit lower and pay more per impression.
What the Numbers Mean for Your Campaigns
CTR alone is a vanity metric if the traffic does not convert. A 2% CTR with a 0.8% landing-page conversion rate can lose to a 1.2% CTR with a 2.5% conversion rate. Always pair platform benchmarks with your own site metrics.
CPM inflation has been steady. The ultra-cheap inventory of 2021–2022 is gone. Accounts that still expect $4–6 CPMs on Meta in competitive verticals will keep missing scale. Budget planning must reflect current auction reality.
Hook rate has become the leading indicator of creative health. If fewer than 25% of people watch past the first three seconds, the rest of the metrics rarely recover. Fix the open or kill the ad.
Completion rates matter most for brand and consideration campaigns. For pure direct-response, a strong 15-second ThruPlay rate on Meta or a solid 6-second view rate on TikTok often drives better efficiency than full completion.
How Motion Graphics Fit Into 2026 Video Performance
Many of the highest-performing short-form ads lean heavily on motion graphics rather than pure live-action. Clean product animations, feature reveals, and text sequencing frequently outperform polished live footage for complex offers and software products. For a deeper look at why that happens and how to execute it, see our full breakdown of Animated Ads: How Motion Graphics Boost Conversions. The same principles that lift conversion rates also push hook rates and CTR into the top quartile of these benchmarks.
Practical Benchmark Application Framework
- Pull your last 30–60 days of video performance by platform and placement.
- Map each metric against the ranges above. Flag anything more than 30% below median for immediate review.
- Segment by creative type (UGC, product demo, motion graphics, founder-led). The gap between best and worst creative usually dwarfs platform differences.
- Set internal targets one tier above your current median, not the absolute top 10%. Stretch goals that ignore your baseline create frustration.
- Re-benchmark quarterly. Auction dynamics and creative norms shift fast enough that last year’s “good” becomes this year’s average.
What I’d do with a mid-size DTC account tomorrow: export the top 20% and bottom 20% of video ads by cost per result, then force the creative team to reverse-engineer the winners’ first three seconds. Most performance lifts start there.
Common Mistakes When Using Video Advertising Benchmarks 2026
Treating global averages as gospel. Industry and audience quality move the numbers dramatically. Always layer vertical-specific data on top of platform averages.
Ignoring placement differences. A Meta Reels CTR of 2% is solid. The same creative in Feed might sit at 1.2%. Mixing placements without segmentation creates false conclusions.
Chasing completion rate on direct-response campaigns. Full views feel good. Conversions pay the bills. Optimize for the metric that maps to revenue.
Using 2023 or 2024 numbers. CPM and CTR baselines have shifted. Outdated benchmarks produce unrealistic forecasts and poor budget decisions.
Failing to separate prospecting from retargeting. Retargeting CTRs and ROAS routinely double or triple prospecting numbers. Blended averages hide the truth.
Key Takeaways
- Meta video still leads on CTR and targeting precision; TikTok wins on cost efficiency for younger demographics.
- Hook rate under 25% is the clearest early warning that creative needs work.
- Expect CPMs in the high single digits to mid-teens on major platforms for competitive US audiences.
- Motion-heavy and UGC-style creatives continue to outperform polished brand films on most social placements.
- Benchmarks are calibration tools, not guarantees. Your vertical, offer strength, and creative quality move results more than platform averages.
- Revisit these numbers every quarter; the environment does not stand still.
- Pair every platform metric with your own conversion and LTV data before declaring success or failure.
Strong video performance in 2026 is less about finding a secret format and more about disciplined measurement against current reality. Use these benchmarks to set the floor, then beat them with better hooks, clearer offers, and faster creative iteration. The accounts that treat the numbers as living targets instead of static trophies keep scaling while others plateau.
FAQs
What is a good CTR for video ads in 2026?
On Meta, 1.5%+ is solid for most verticals; 2%+ is strong. On TikTok, 1%+ is competitive for DTC. YouTube in-stream sits lower at 0.5–0.7%. Always compare against your industry and objective rather than a single number.
How do Video Advertising Benchmarks 2026 differ by industry?
Fashion, beauty, and consumer packaged goods usually clear higher CTRs and stronger ROAS. Finance, legal, and B2B tech face higher CPMs and lower CTRs. Vertical-specific data should always override broad platform averages.
Should I prioritize completion rate or hook rate?
For direct-response campaigns, prioritize hook rate and early engagement metrics that correlate with clicks and conversions. Completion rate matters more for brand awareness and consideration objectives.